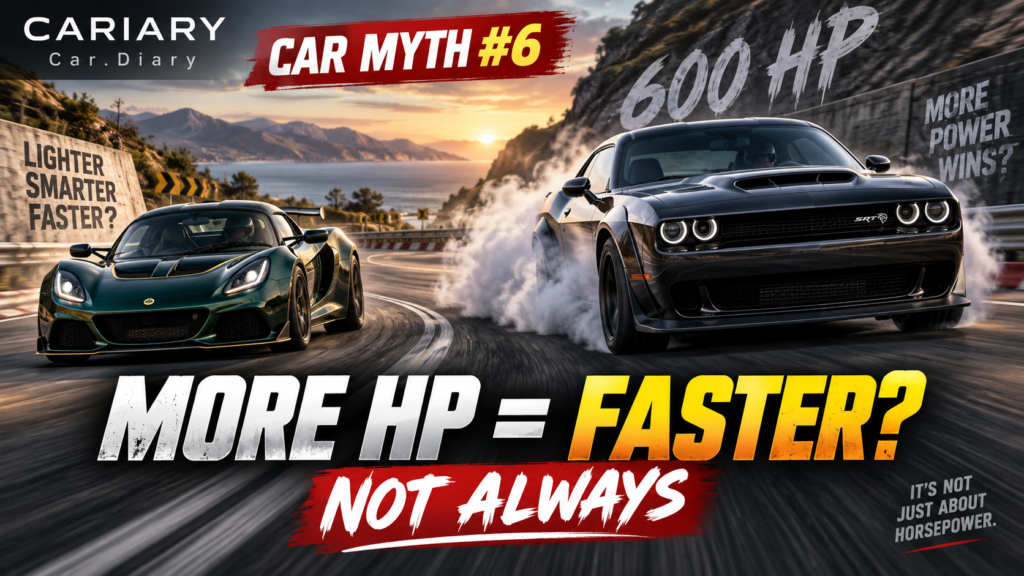
More Horsepower sounds like an easy answer to almost any performance question. Put 300 hp, 500 hp and 700 hp on a page, and our eyes have already arranged the finishing order before the cars have moved.
Then a lighter car gets away from something more powerful, or an all-wheel-drive car wins the launch but loses the next part of the acceleration test. Suddenly the number that seemed to explain everything needs some help.
This is Car Myths Part 6. The question is not whether power matters. It matters enormously. The question is whether one peak output figure can tell us which whole car is faster, without first saying what we mean by fast.

Quick Summary
- Horsepower measures power, not acceleration, maximum speed or lap time directly.
- Power relative to mass is more revealing than output alone, but traction and gearing can change the result.
- A standing start, a rolling acceleration test and a circuit lap ask different things of a car.
- Aerodynamic resistance becomes increasingly important at high speed, while heat management affects repeatability.
- Compare the whole package and the test conditions, not just the biggest number on the specification sheet.
1. More Horsepower Measures Potential, Not a Finishing Order
Horsepower is a unit of power: the rate at which work is done or energy is transferred. Kilowatts measure the same physical quantity in a different unit. Neither is a unit of vehicle speed.
For a combustion engine, the advertised number commonly describes peak output at the engine, before losses through the rest of the drivetrain. Electric and hybrid vehicles may quote motor or combined system output, sometimes with temporary boost conditions. Read the definition rather than assuming every headline was measured in the same place or can be sustained indefinitely.
What do we actually mean by faster?
| Question | What the test reveals | What it does not settle |
|---|---|---|
| Which reaches 100 km/h first? | Launch, usable traction, gearing and acceleration through that interval | High-speed performance or a whole lap |
| Which accelerates faster from a rolling start? | Delivered power in the chosen gears and speed range, relative to resistance and mass | Launch ability |
| Which has the higher maximum speed? | Available power versus resistance, plus gearing and limits | Cornering or responsiveness |
| Which laps a circuit faster? | Braking, corners, acceleration, consistency and driver execution | Every other circuit or road condition |
Even two 0-100 km/h figures need context. Surface, weather, tires, load, launch mode and whether timing includes the very first movement can affect comparisons. A 0-60 mph result is not the same interval: 60 mph is approximately 96.6 km/h.
The honest answer to “which is faster?” often begins with another question: faster at doing what? All high-speed and limit-handling examples here refer to controlled testing or closed circuits, not experiments on public roads.
Torque is not horsepower’s rival
Torque is a twisting effect. Power combines that torque with how quickly the shaft is rotating. In compatible units, power equals torque multiplied by angular speed. OpenStax’s rotational-power explanation gives that relationship.
For example, 400 Nm at 3,000 RPM and 200 Nm at 6,000 RPM both correspond to about 126 kW. These are calculated operating points, not two complete engine specifications. The second produces less torque but delivers it through twice as many revolutions per minute.
That is why “torque for acceleration, horsepower for top speed” is an incomplete shortcut. Gears change the torque reaching the wheels. We need the torque and power available at the operating point, together with the chosen ratio. Engine Power Basics takes this relationship further.
2. The Same Power Has More Work to Do in a Heavy Car
Pushing an empty trolley and a heavily loaded one makes the basic idea familiar: the same net force produces less acceleration when it has more mass to accelerate. A car adds traction, rotating components and resistance to that picture, but mass has not stopped mattering.
Consider two fictional cars using the same horsepower convention and comparable mass definitions:
| Teaching example | Peak power | Mass | Power per metric tonne |
|---|---|---|---|
| Car A | 500 hp | 2,200 kg | About 227 hp/tonne |
| Car B | 400 hp | 1,400 kg | About 286 hp/tonne |
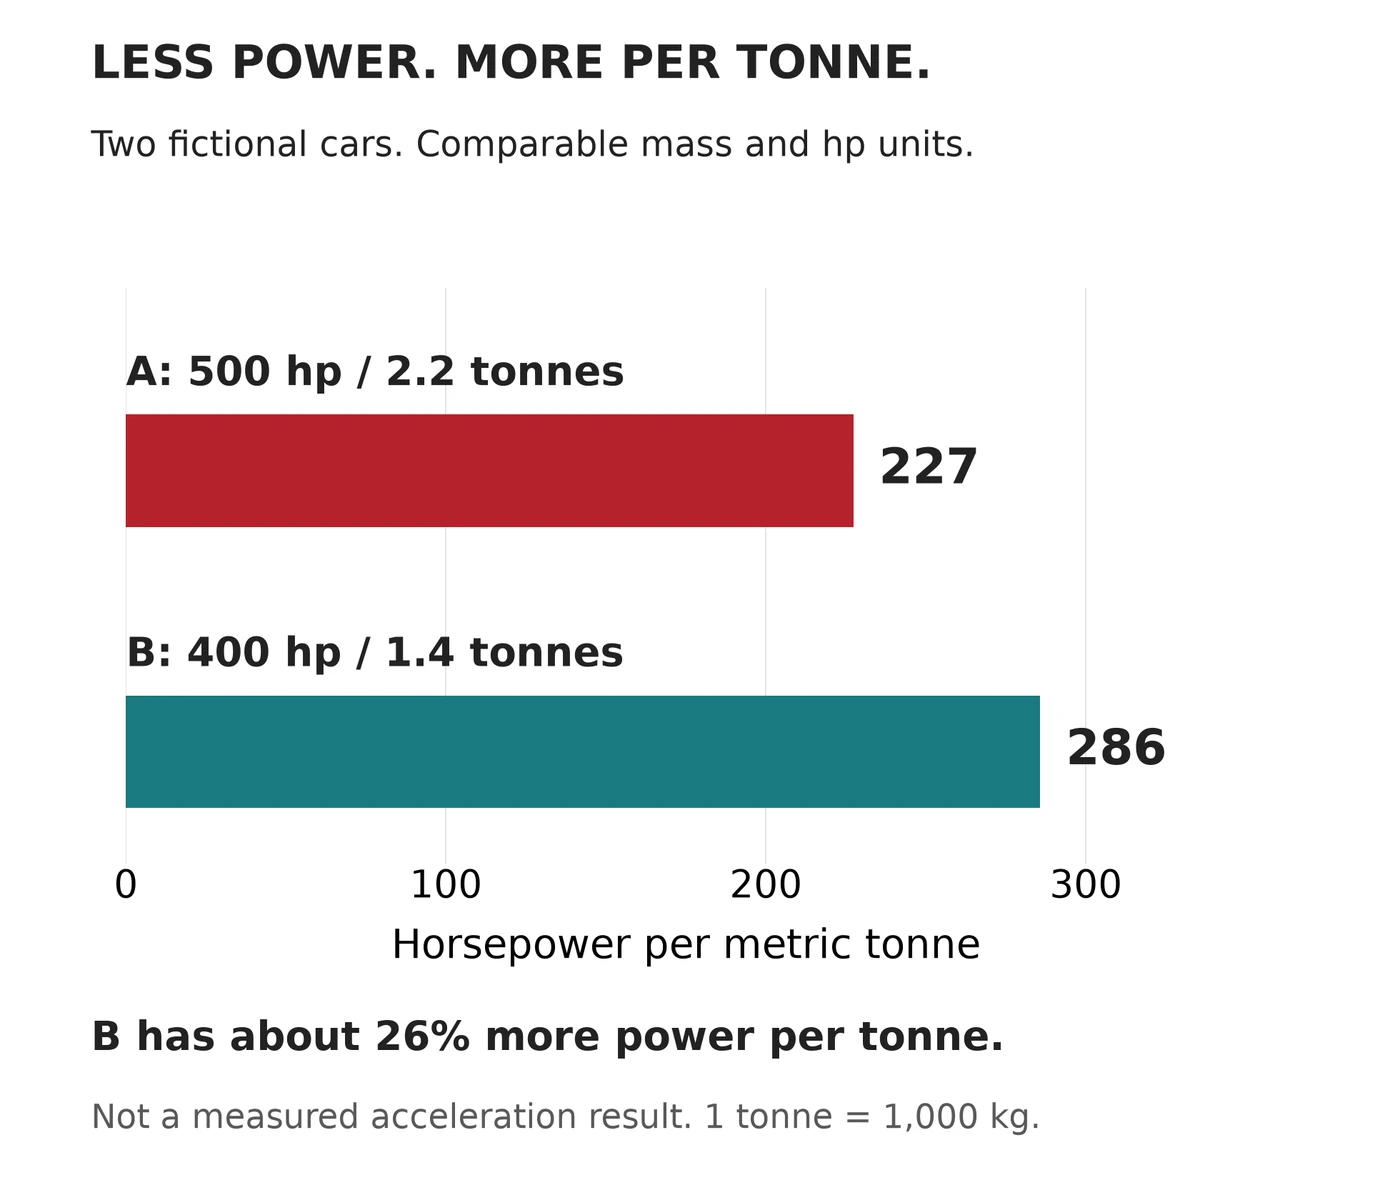
Divide horsepower by mass in tonnes to obtain power-to-weight ratio. One metric tonne is 1,000 kg. Car B has less total power but approximately 26% more power per tonne. That gives it a useful acceleration advantage when comparable fractions of that power can actually be delivered.
It does not establish a measured 0-100 time, nor does it guarantee 26% faster acceleration everywhere. Peak power may not be available throughout the test, and either car can be limited by traction or a shift. Air resistance does not simply scale with vehicle mass either.
Why light cars can feel so lively
Lower mass reduces the energy needed for the same speed increase. It also reduces the kinetic energy the brakes must manage when slowing from the same speed. That can help repeated performance without requiring enormous hardware.
Where the mass sits matters too. A compact distribution around the car’s center can reduce resistance to changes in rotation, while axle loads affect how the tires work. Two cars with the same power-to-weight ratio can therefore respond quite differently to steering and throttle.
But lightness alone does not guarantee shorter tire-limited braking distances or better cornering. Tire characteristics, geometry, damping and balance still count. Suspension Basics explains why body control involves more than a low weight figure.
A modestly powered lightweight sports car can feel eager because several responses work together. Sound, seating position and how quickly acceleration builds also influence the sensation. Feeling fast and recording the quickest time are related experiences, not identical measurements.
3. Traction Can Win the Start Before Power Wins the Straight
For an engine to accelerate a car, the tires must transmit a forward force from the road. If the requested drive torque exceeds what the driven tires can use, excessive wheel slip can follow. Extra rotation is not the same thing as extra forward progress.
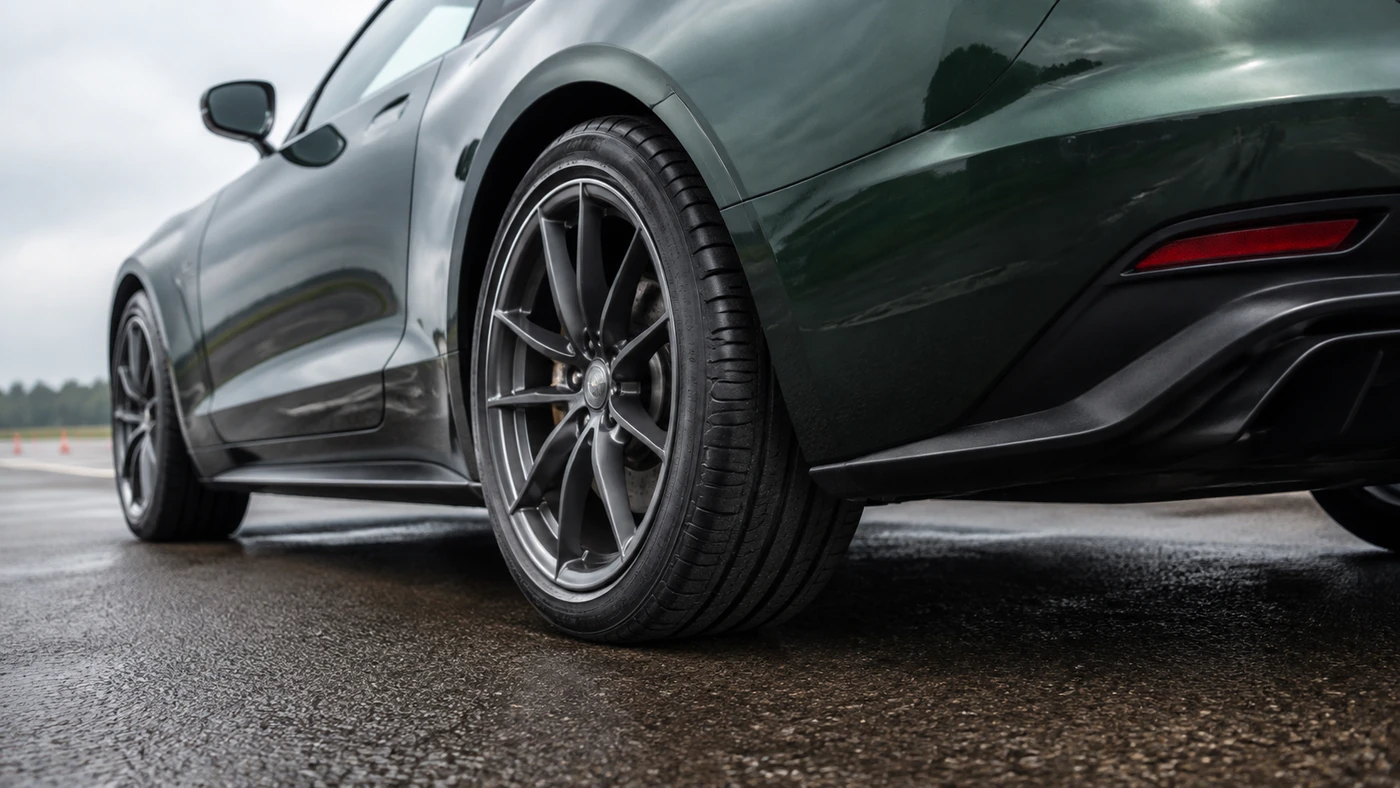
Imagine a fictional 700 hp rear-wheel-drive car struggling for traction against a 550 hp all-wheel-drive car with suitable tires and an effective launch strategy. The lower-power car could reach 100 km/h first. We have described a possibility, not supplied enough data to calculate a winner.
What AWD actually adds
All-wheel drive can share propulsion between front and rear tires instead of asking only one axle to transmit the drive force. Torque distribution and slip control help use the available traction across those driven contact patches.
It does not double the road’s friction or make every AWD car a better launcher. During acceleration, load shifts rearward; axle loads, tire behavior and control strategy matter. Front-wheel drive must cope with unloading of its driven axle, while rear-wheel drive can benefit from increased rear load. Layout alone still does not decide the test.
BMW’s launch-control explanation for the iX M60 is a real example of drive and chassis controls coordinating power delivery and wheel-slip management. It illustrates the system approach, not a universal advantage over every higher-power car.
In a combustion car, launch control may manage engine speed, torque and clutch engagement, depending on the transmission. An EV uses different hardware and control possibilities. Neither system bypasses the tires or guarantees identical results at every battery temperature, load or road condition.
The right tires, not simply the most expensive tires
Compound, tread, temperature, wear, inflation and the surface affect grip. A suitable summer performance tire can be excellent in its intended environment, but its label is not a promise of winter capability. Michelin’s seasonal-tire guide explains those different operating priorities.
Price alone is not a friction measurement, and a slick surface can defeat impressive hardware. AWD’s acceleration traction should not be mistaken for an automatic reduction in emergency stopping distance. For the braking side of this relationship, see Brake and Tire Basics.
The practical insight is that power the car cannot use for propulsion is not useful acceleration at that moment. Sometimes traction control reducing torque is exactly what helps it move forward effectively.
4. Gearing and the Powerband Decide What Reaches the Wheels
The peak horsepower figure is one point on an engine’s operating map. Real acceleration takes place through changing engine speeds and gears. The route between those points matters.
Short gears multiply torque, not power
A reduction gear trades rotational speed for torque. A numerically larger overall reduction, often called shorter gearing, turns the wheels more slowly for a given engine speed while multiplying torque more strongly.
Here is an idealized snapshot. Both cases receive 200 Nm at 6,000 RPM, approximately 126 kW. We ignore losses and rotating inertia to isolate the ratio:
| Overall reduction | Output speed | Output torque | Ideal power |
|---|---|---|---|
| 10:1 | 600 RPM | 2,000 Nm | About 126 kW |
| 5:1 | 1,200 RPM | 1,000 Nm | About 126 kW |
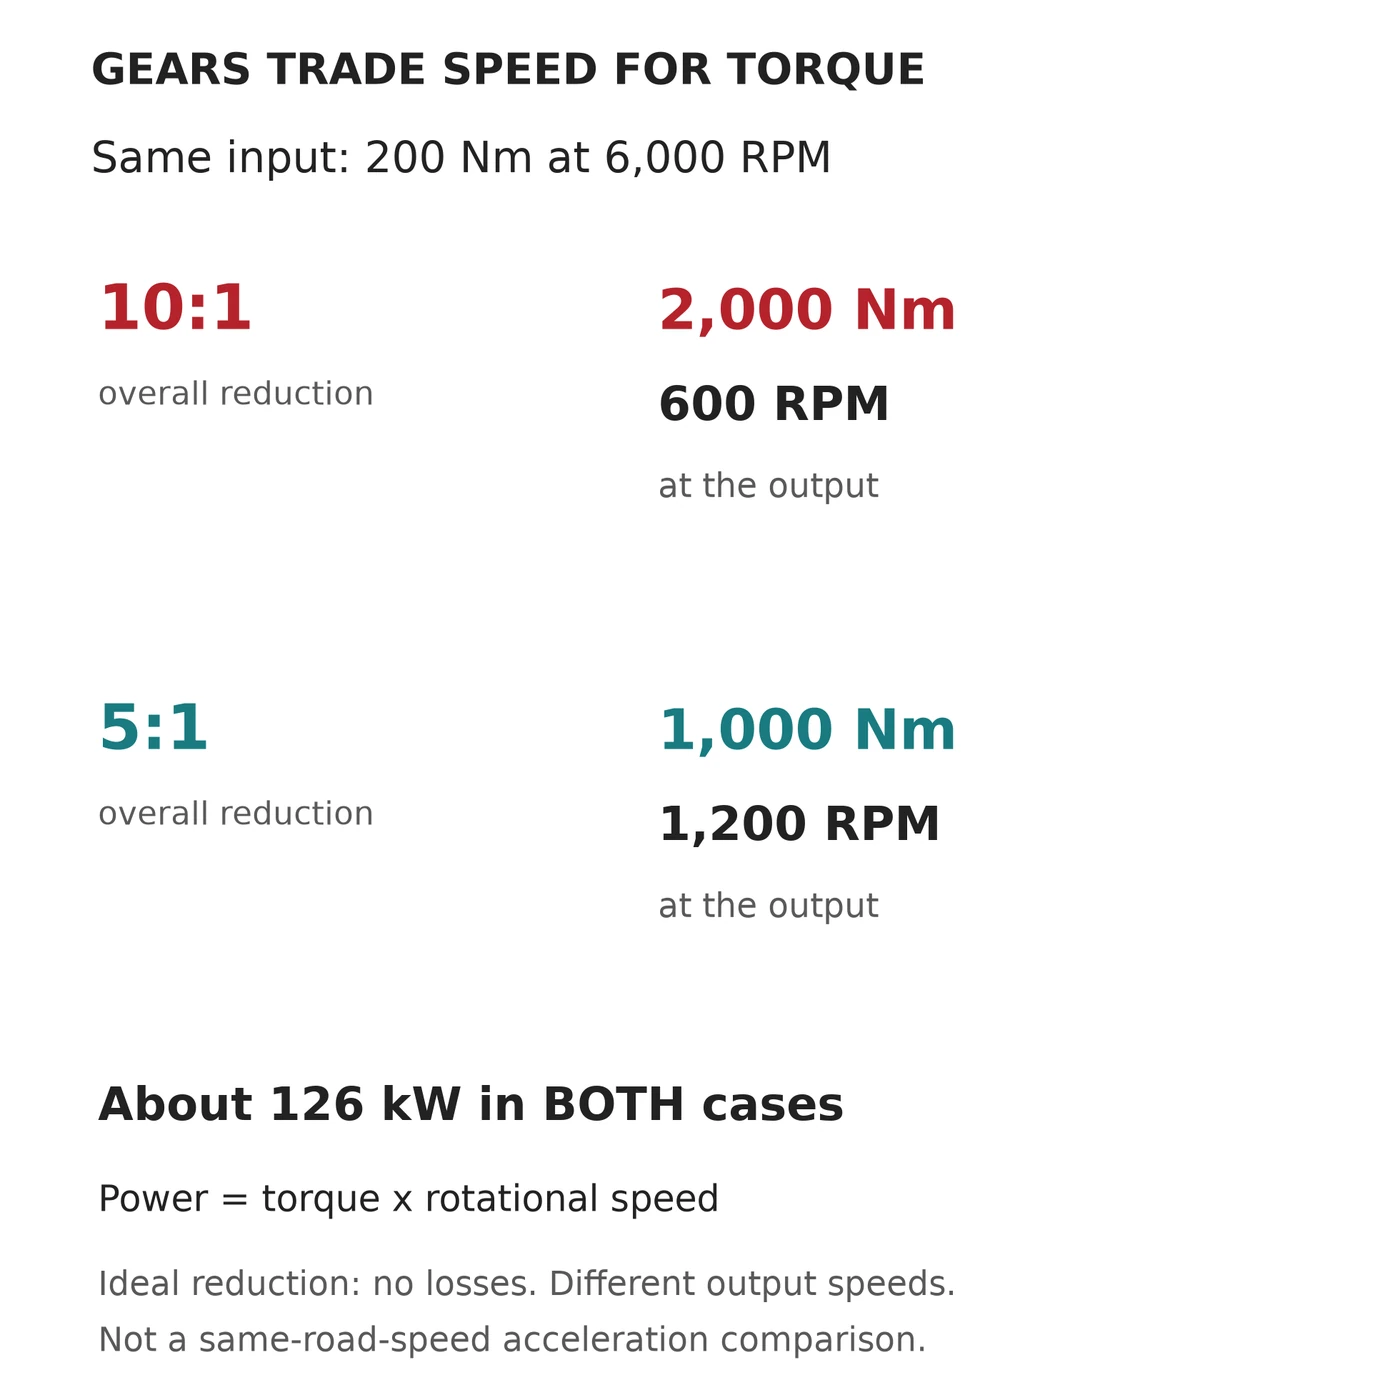
The 10:1 case has twice the output torque at half the output speed. It has not created energy. With the same tire radius, those output speeds represent different vehicle speeds, so this is not a same-road-speed acceleration comparison.
At a particular road speed, changing gear changes engine RPM, and therefore the torque and power available from the engine. Final drive, the reduction near the driven axle, and tire rolling radius are also part of the overall relationship. Drivetrain Basics connects these parts.
A quick gearbox keeps the engine in useful territory
Shift duration can interrupt or reduce drive force. Gear spacing determines where engine speed lands after a shift. A well-matched dual-clutch transmission or automatic can limit those interruptions and keep the engine working effectively.
More gears are not automatically better, and shorter gearing can require an additional shift before the end of a timed interval. Taller gearing may provide a higher theoretical speed at the rev limit, yet the engine may lack the power to pull it against resistance. Transmission torque capacity and software limits can also restrict delivered output.
A broad powerband is useful, but not another magic score
A fictional engine with a 500 hp peak in a narrow upper-RPM range might feel less immediate in everyday driving than a 450 hp engine delivering strong output through the revs actually being used. Gear availability, throttle response and how quickly the engine reaches that range influence the impression.
People sometimes call this “area under the curve.” It is a useful reminder to inspect more than the peak, but the raw area under a power-versus-RPM graph is not a direct acceleration result. The transmission determines which part of the curve the engine visits and for how long. A high-revving engine with well-chosen ratios can exploit a relatively narrow strong region extremely well.
Turbocharged engines often offer substantial low- and mid-range torque. That can make ordinary acceleration feel strong without a downshift, although turbo response and calibration vary. Naturally aspirated engines are not automatically weak or slow; using the appropriate gear can change the comparison.
EVs make the distinction especially clear
An electric motor can produce substantial torque from very low speed. Many EVs also avoid multi-gear shift interruptions and control torque rapidly. Those properties can produce a forceful launch without the largest headline output.
However, high launch torque is not peak power at zero RPM. Mechanical power equals torque times rotational speed, so at a stationary shaft the mechanical output power is zero even if torque is present. As rotation increases, the power relationship changes.
Nor are all EVs single-speed. Porsche’s 2019 Taycan introduction describes a two-speed rear transmission: a short first gear for acceleration and a longer second gear for efficiency and higher-speed capability. It is a useful historical example of gearing remaining relevant after the combustion engine disappears.
5. Air Resistance Changes the Question at High Speed
A strong launch does not guarantee the same advantage from 100 to 200 km/h. As speed rises, a powerful car can become less constrained by initial traction and more constrained by the power available after overcoming resistance. There is no universal speed at which that change happens.
In simplified straight-line motion, power associated with a forward force is force multiplied by vehicle speed. That means a given usable power corresponds to less propulsive force as speed rises. Subtract resisting forces and divide by mass to estimate acceleration. OpenStax’s power chapter explains the underlying force-times-speed relationship.
This approximation is useful away from zero speed. It is not a launch model with infinite force at standstill, and it assumes appropriately delivered power rather than simply inserting the brochure peak.
Drag force and drag power are different
Aerodynamic drag depends on air density, shape, reference area and speed through the air. Under unchanged conditions, drag force scales approximately with speed squared. NASA’s drag equation provides that starting point.
For a car moving through still air, multiplying drag force by road speed gives the power needed to overcome that drag. That power therefore scales approximately with speed cubed. This distinction is why “double the speed needs four times the power” is not correct for the aerodynamic part alone.
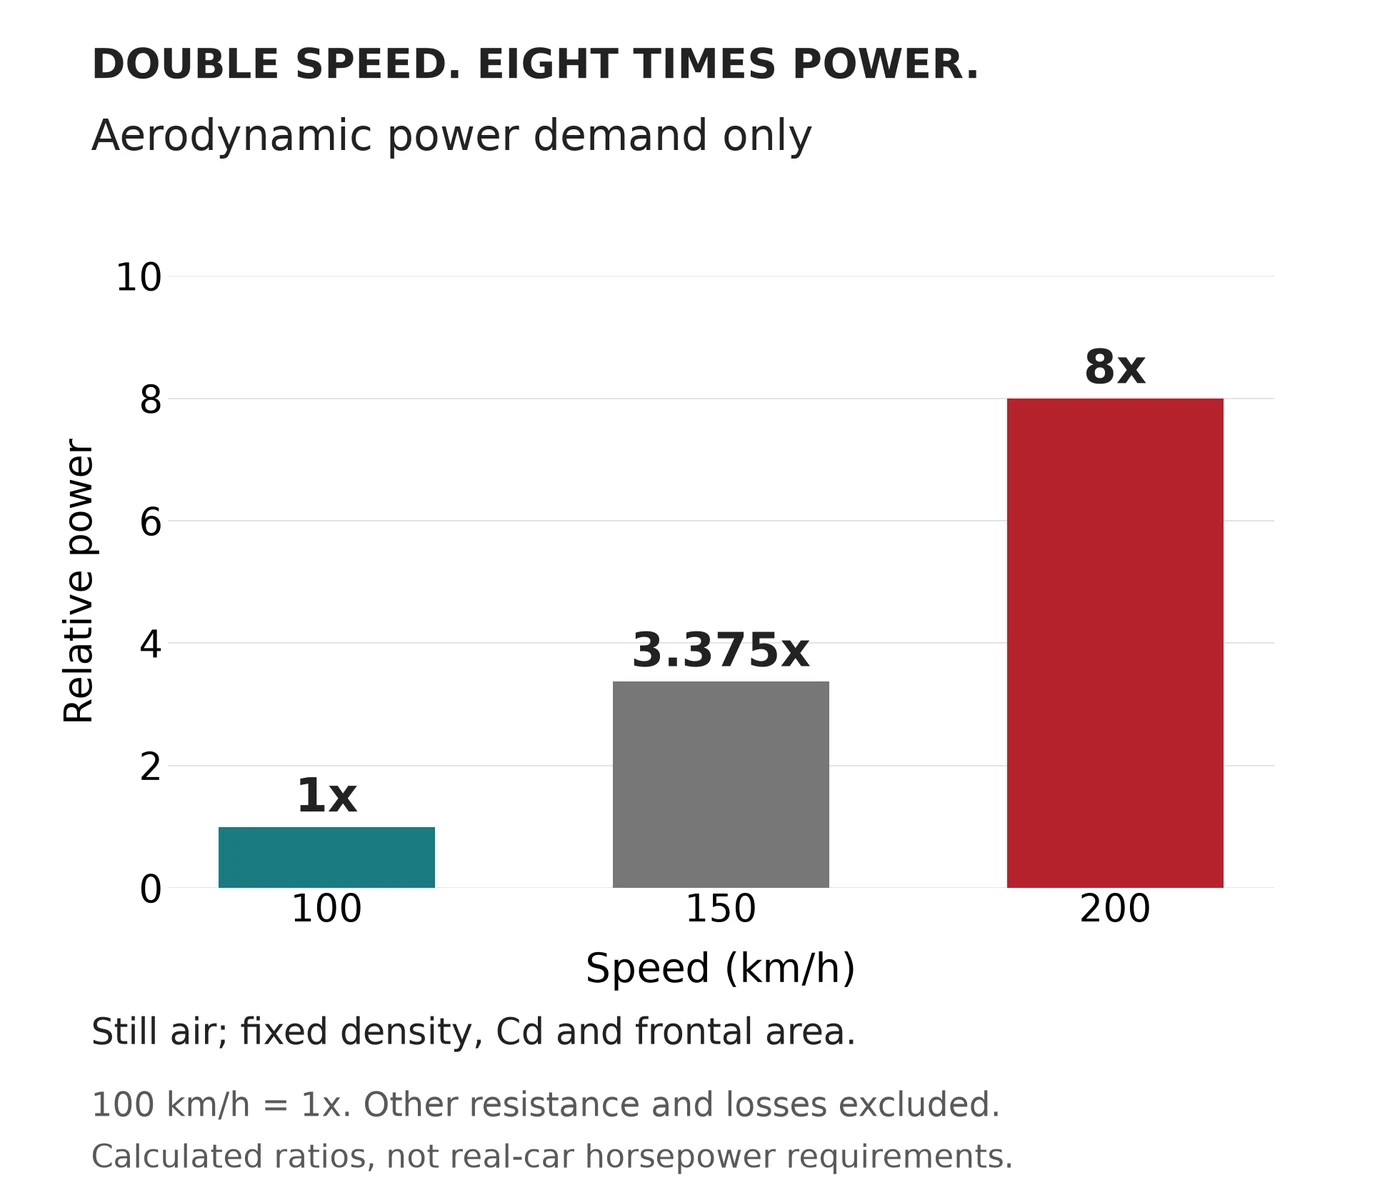
For a normalized illustration, if aerodynamic power demand is 1 at 100 km/h, it is 3.375 at 150 km/h and 8 at 200 km/h. These are ratios, not horsepower requirements for a real car. Density, drag coefficient and frontal area are held constant; rolling resistance, wind, gradients and drivetrain losses are excluded.
A low drag coefficient is not the whole aerodynamic story
Frontal area matters alongside the drag coefficient, commonly written Cd. A large SUV and a low sports car can present very different effective drag areas even if one coefficient looks favorable.
That helps explain how a 500 hp sports car could challenge a 600 hp SUV at high speed. It remains a hypothetical comparison: actual drag area, delivered power, mass and gearing are needed to say more. Looking low and sleek is not a substitute for measured aerodynamic data.
Downforce buys a different kind of speed
Downforce is an aerodynamic load pushing the car toward the road. A well-designed package can increase the tire forces available for cornering at speed, but often brings additional drag. The trade-off depends on the whole design; not every aerodynamic improvement has the same penalty.
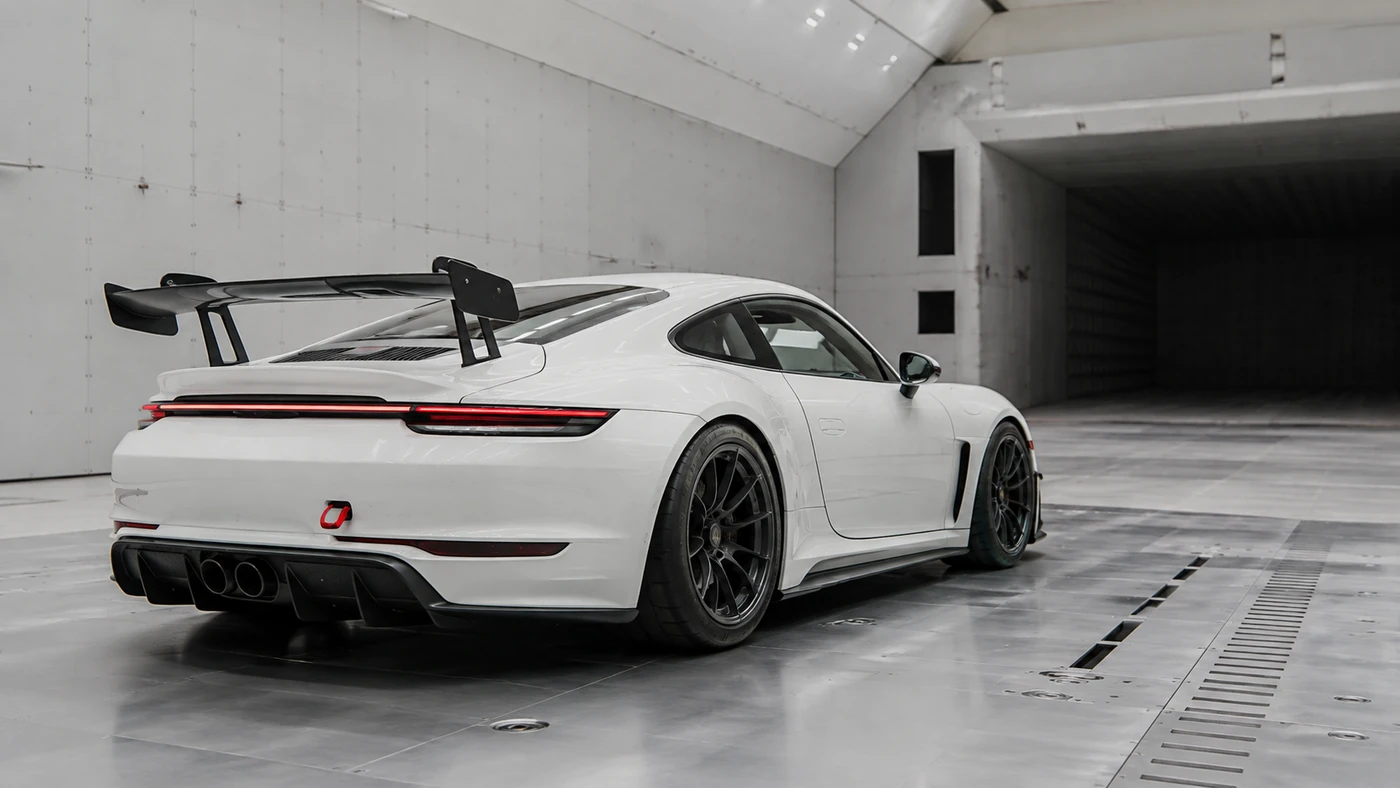
A track-focused car can therefore gain through corners while giving away straight-line speed. A wing alone is not a lap-time guarantee, and its effect at low speed is limited compared with its effect at high speed. Aerodynamic balance between the axles matters as much as an impressive-looking rear component.
6. A Fast Lap Needs More Than a Fast Straight
Imagine a 650 hp heavy grand tourer and a 400 hp lightweight track car. On a circuit with many corners and braking zones, the lighter car could win through the combined quality of its tires, brakes, suspension, aero and responses. On another layout, the grand tourer’s power could be much more influential.
The lower-power car is not automatically able to brake later simply because it is lighter. Nor does the higher-power car have to use full throttle everywhere. The point is that a lap combines many tasks, and output alone cannot rank the packages.
A real example from the Nordschleife
Porsche reported a 6:49.328 lap of the 20.8 km Nordschleife for the 992-generation 911 GT3 RS in October 2022. Its U.S. release lists 518 hp, equivalent to the 386 kW rating; European material expresses the output as 525 PS. Those horsepower conventions should not be mixed casually.
The car used the Weissach package and optional Michelin Pilot Sport Cup 2 R tires, with Jorg Bergmeister driving. Porsche’s original lap report emphasizes aero, cooling and chassis engineering as well as the engine.
This is a documented example of a complete performance package, not a controlled experiment proving how much each component contributed. The report also gives a different time for the shorter historical lap configuration. Always match track length, specification, tires and conditions before building a ranking.
Skill determines how much performance gets used
Braking judgment, line choice and smooth control change lap time even in the same car. A high-output rear-wheel-drive car may ask more of the driver’s throttle control on corner exit, particularly with limited grip. Electronics help, but cannot create unlimited capacity at the tire.
Adding power alone does not physically make a car slower under every condition. Problems arise if the change overwhelms thermal or traction capacity, disrupts the package, or makes consistent control harder. A driver may then spend more time correcting or waiting rather than accelerating.
The fifth run matters too
Sustained high output generates heat that the powertrain must manage. In a turbocharged engine, charge-air cooling helps maintain suitable intake conditions. Garrett’s intercooler explanation describes why removing heat from compressed air matters.
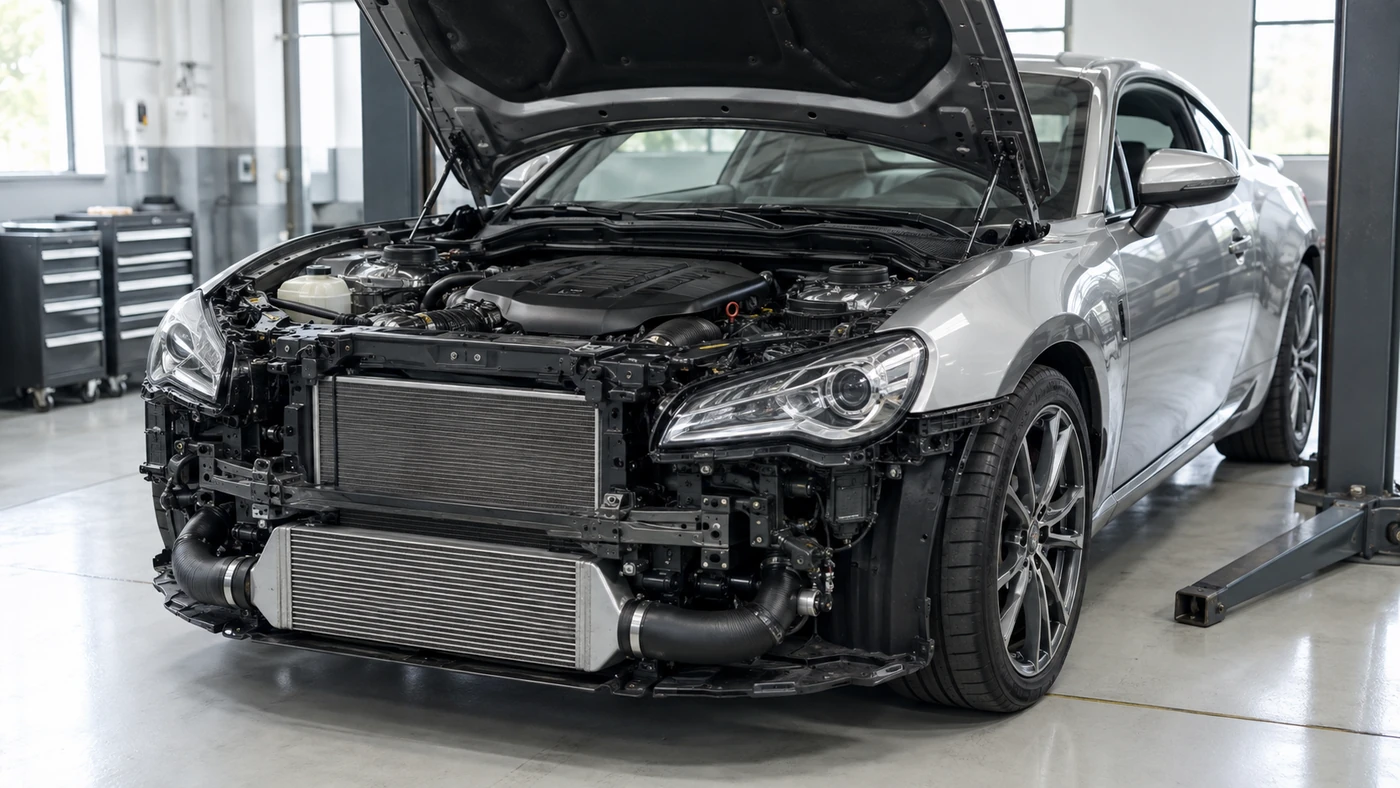
If temperatures move beyond the intended range, control systems may reduce output to protect components. The exact behavior varies; there is no universal rule that a 600 hp engine becomes a 500 hp engine after a particular number of runs. Oil, coolant, charge air and transmission temperatures can all be relevant.
EVs have their own battery, motor and inverter limits. Tesla’s Model 3 Track Mode instructions explicitly discuss managing thermal load and trading initial output for more consistent repeated performance. Available features depend on vehicle configuration and software.
A lower peak that remains available can be more useful over a session than a higher number available only briefly. That does not make temporary boost dishonest when its conditions are disclosed. It makes duration part of the specification we should read.
7. Read the Measurement Before Ranking the Car
Power figures become much more useful when we know where, how and under what conditions they were measured.
Crank power is not a chassis-dyno result
An engine rating at the crankshaft is upstream of the transmission and final drive. Gears, bearings, seals and other elements consume some power. A chassis dynamometer measures performance through the driven wheels and its own test arrangement, rather than simply repeating the engine-bench measurement.
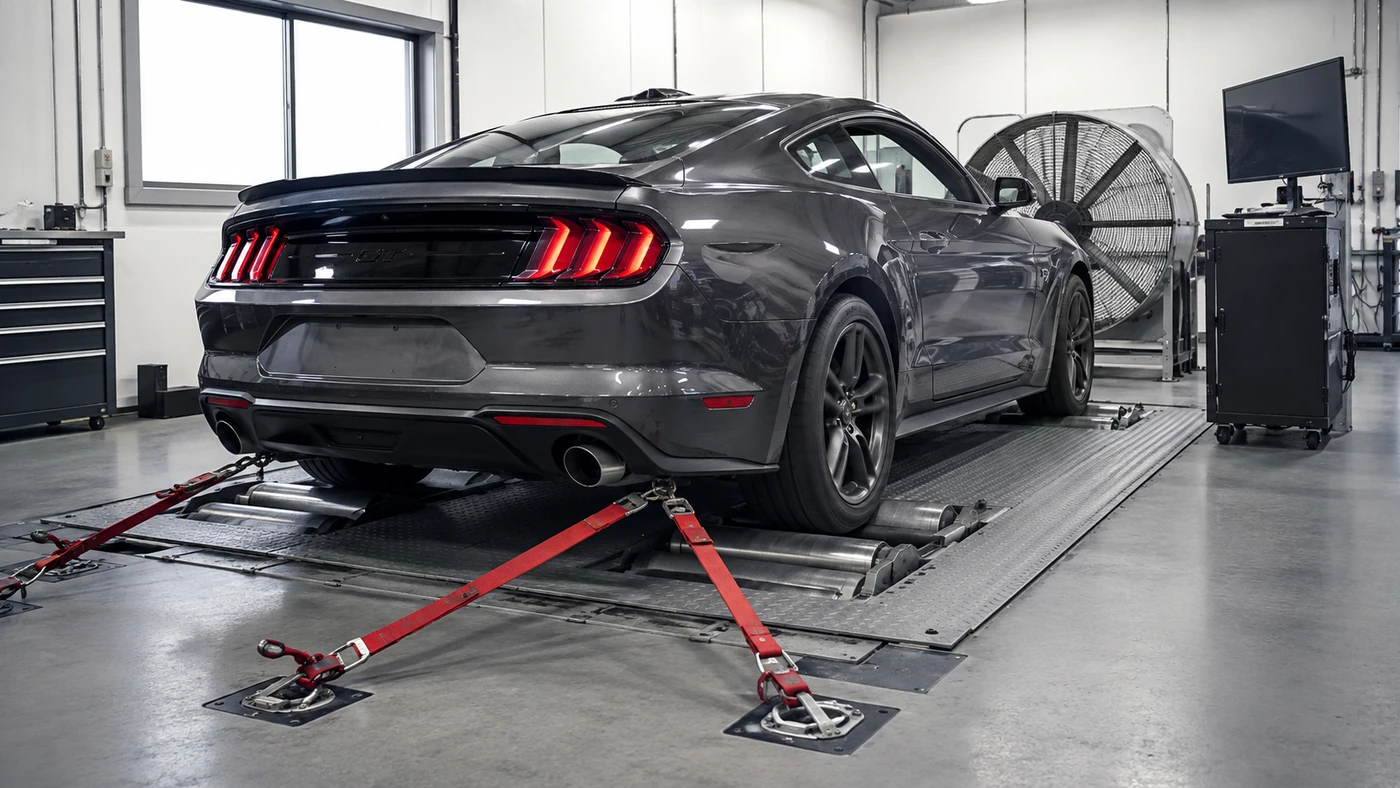
The physical route varies. A conventional longitudinal rear-drive car usually sends torque from the gearbox through a propeller shaft, final drive and differential, then half-shafts to the wheels. A front-drive transaxle integrates several functions; a multi-motor EV may have separate drive units. There is no single component order covering every layout.
AWD can add mechanical losses and mass, but those vary with architecture and operating condition. Do not apply an automatic 15%, 20% or any other fixed conversion to every car. The extra driven axle may improve a launch despite a loss elsewhere in the system.
An SAE paper abstract on chassis-dyno versus rated output identifies those measurement reference frames as a distinct issue. Wheel-power figures can be useful without being directly interchangeable with advertised engine output.
Even two dyno sheets need matching conditions
Dyno type, gear, tire behavior, temperatures, loading method and correction convention can affect the result. Dynojet’s correction-factor documentation explains adjustments for atmospheric conditions such as pressure, humidity and temperature.
A correction does not turn every test rig and procedure into the same experiment, nor does it restore output lost through thermal protection. Look for repeatable procedures and stated conditions, not a screenshot with the largest peak. A power trace also does not measure tire traction on a wet road or the car’s aerodynamic resistance at speed.
Maximum speed has several possible ceilings
At a power-limited maximum speed on level ground, the power available for propulsion balances the power required to overcome resistance. Additional usable power can raise that ceiling, but aerodynamic demand grows rapidly.
A car can instead meet its rev limit in the selected gear or an electronic speed limiter first. Tire capability, stability and cooling constrain the manufacturer’s approved operating envelope too; a tire’s speed rating is not permission to perform a maximum-speed test. More engine output does not override these limits.
Put the numbers back together
Return to two new fictional packages: a 550 hp, 2,300 kg AWD car and a 420 hp, 1,450 kg RWD car. Their ratios are about 239 and 290 hp per tonne respectively. We still cannot name an overall winner.
| Test | Why the result could change |
|---|---|
| Standing start | AWD and an effective launch may help the heavier car use more of its power early |
| Tight circuit | The lighter car may gain through a well-matched chassis, tires and braking package |
| Higher-speed acceleration | Delivered power, drag area, gearing and mass must be considered together |
| Repeated runs | Thermal limits, tire condition and control consistency become part of the result |
These are reasons for testing, not invented results. The missing data cannot be filled in from drivetrain badges or body shape.
Common Misconceptions
“Horsepower does not matter.” It absolutely matters. Extra usable power helps when power is the limitation; the mistake is treating it as the only limitation.
“Power-to-weight tells the whole story.” It improves on a raw output comparison but leaves out traction, gearing, aero and how the power is delivered.
“Instant EV torque means maximum horsepower from a standstill.” Torque can be present at zero shaft speed while mechanical power is zero. The two quantities are related, not interchangeable.
“Shorter gears create extra horsepower.” They trade rotational speed for torque. Real gears also incur losses.
“The quickest launch proves the fastest car.” It proves a result over that particular interval and set of conditions, not every kind of performance.
Cariary Thoughts
What changes the way I read a specification sheet is realizing that “fast” is not one question. I can admire an engine’s output and still want to know what happens after the first few seconds, after the next corner, or after another lap.
There is something satisfying about a lighter car doing more with less, but I do not think that makes a high-power car less interesting. Making substantial output usable, predictable and repeatable is an engineering achievement of its own.
The most revealing number may therefore be the one missing from the headline: mass, tire specification, the chosen speed interval, or how long the output lasts. Once those details enter the conversation, performance comparisons become less like scorekeeping and more like understanding the machine.
That is the question I would carry forward: not simply “how much horsepower?”, but “where can this car use it, and what happens when it does?”
One-line Summary
Horsepower gives a car potential; the whole vehicle and the task determine how much becomes usable performance.
FAQ
Does more horsepower always mean faster acceleration?
No. More usable power can help, but traction, mass, gearing and resistance determine the outcome. A peak engine rating does not tell us the wheel force available throughout a particular acceleration interval.
Can a 400 hp car beat a 500 hp car?
Yes. A lighter car can have a higher power-to-weight ratio, and suitable traction or gearing can help it use its output. Whether it actually wins requires a defined test and comparable conditions.
What is power-to-weight ratio?
It is power divided by mass. For example, 400 hp divided by 1.4 metric tonnes is about 286 hp per tonne. It is a useful indicator of acceleration potential, not a complete performance score.
Is torque or horsepower more important?
They describe connected aspects of the powertrain. Torque multiplied by rotational speed gives power. To understand acceleration, consider output across the working range, the gearing, wheel force and the vehicle’s resistance and mass.
Why do AWD cars often launch so hard?
They can distribute drive force across both axles, supported by effective control systems. That can help when a two-wheel-drive car is traction-limited, but tires, load transfer and launch conditions still determine the result.
Why can an EV feel quicker than a higher-power combustion car?
Strong low-speed motor torque, rapid control and fewer shift interruptions can make initial acceleration very immediate. Battery conditions, mass and higher-speed output may produce a different result later in the test.
Does aerodynamic drag affect acceleration?
Yes. It consumes some of the power that could otherwise increase speed. With unchanged shape and air conditions, drag force rises approximately with speed squared; aerodynamic power demand in still air rises approximately with speed cubed.
What should I compare alongside horsepower?
Use comparable mass definitions, drivetrain and tire specifications, gearing, the power curve, clearly defined performance tests and repeatability where relevant. Check whether the figure is engine, wheel or system output, and whether special boost conditions apply.
Related Thoughts
- Engine Power Basics: torque, power and turbo response
- Drivetrain Basics: gears, differentials and driven wheels
- Suspension Basics: understanding handling and body control
- Brake and Tire Basics: the other side of performance
References
- OpenStax: power for rotational motion
- OpenStax: power, work and force times speed
- BMW M: iX M60 launch-control coordination
- Michelin: seasonal tire characteristics
- Porsche: original Taycan powertrain and two-speed rear transmission
- NASA Glenn Research Center: drag equation
- Porsche: 2022 GT3 RS Nordschleife lap, specification and conditions
- Garrett Motion: charge-air cooling and intercoolers
- Tesla: Model 3 Track Mode and thermal management
- SAE: abstract on chassis-dyno and rated power measurement
- Dynojet: atmospheric correction factors
Data Reference Date: September 7, 2026. Fictional car comparisons and calculated charts are teaching examples, not Cariary test results. Generated images are labeled educational illustrations, not photographs of measured tests or named vehicles.